Sydney Market Report
Sydney is Australia's largest city, featuring iconic landmarks, stunning beaches, and adventures in the Blue Mountains.
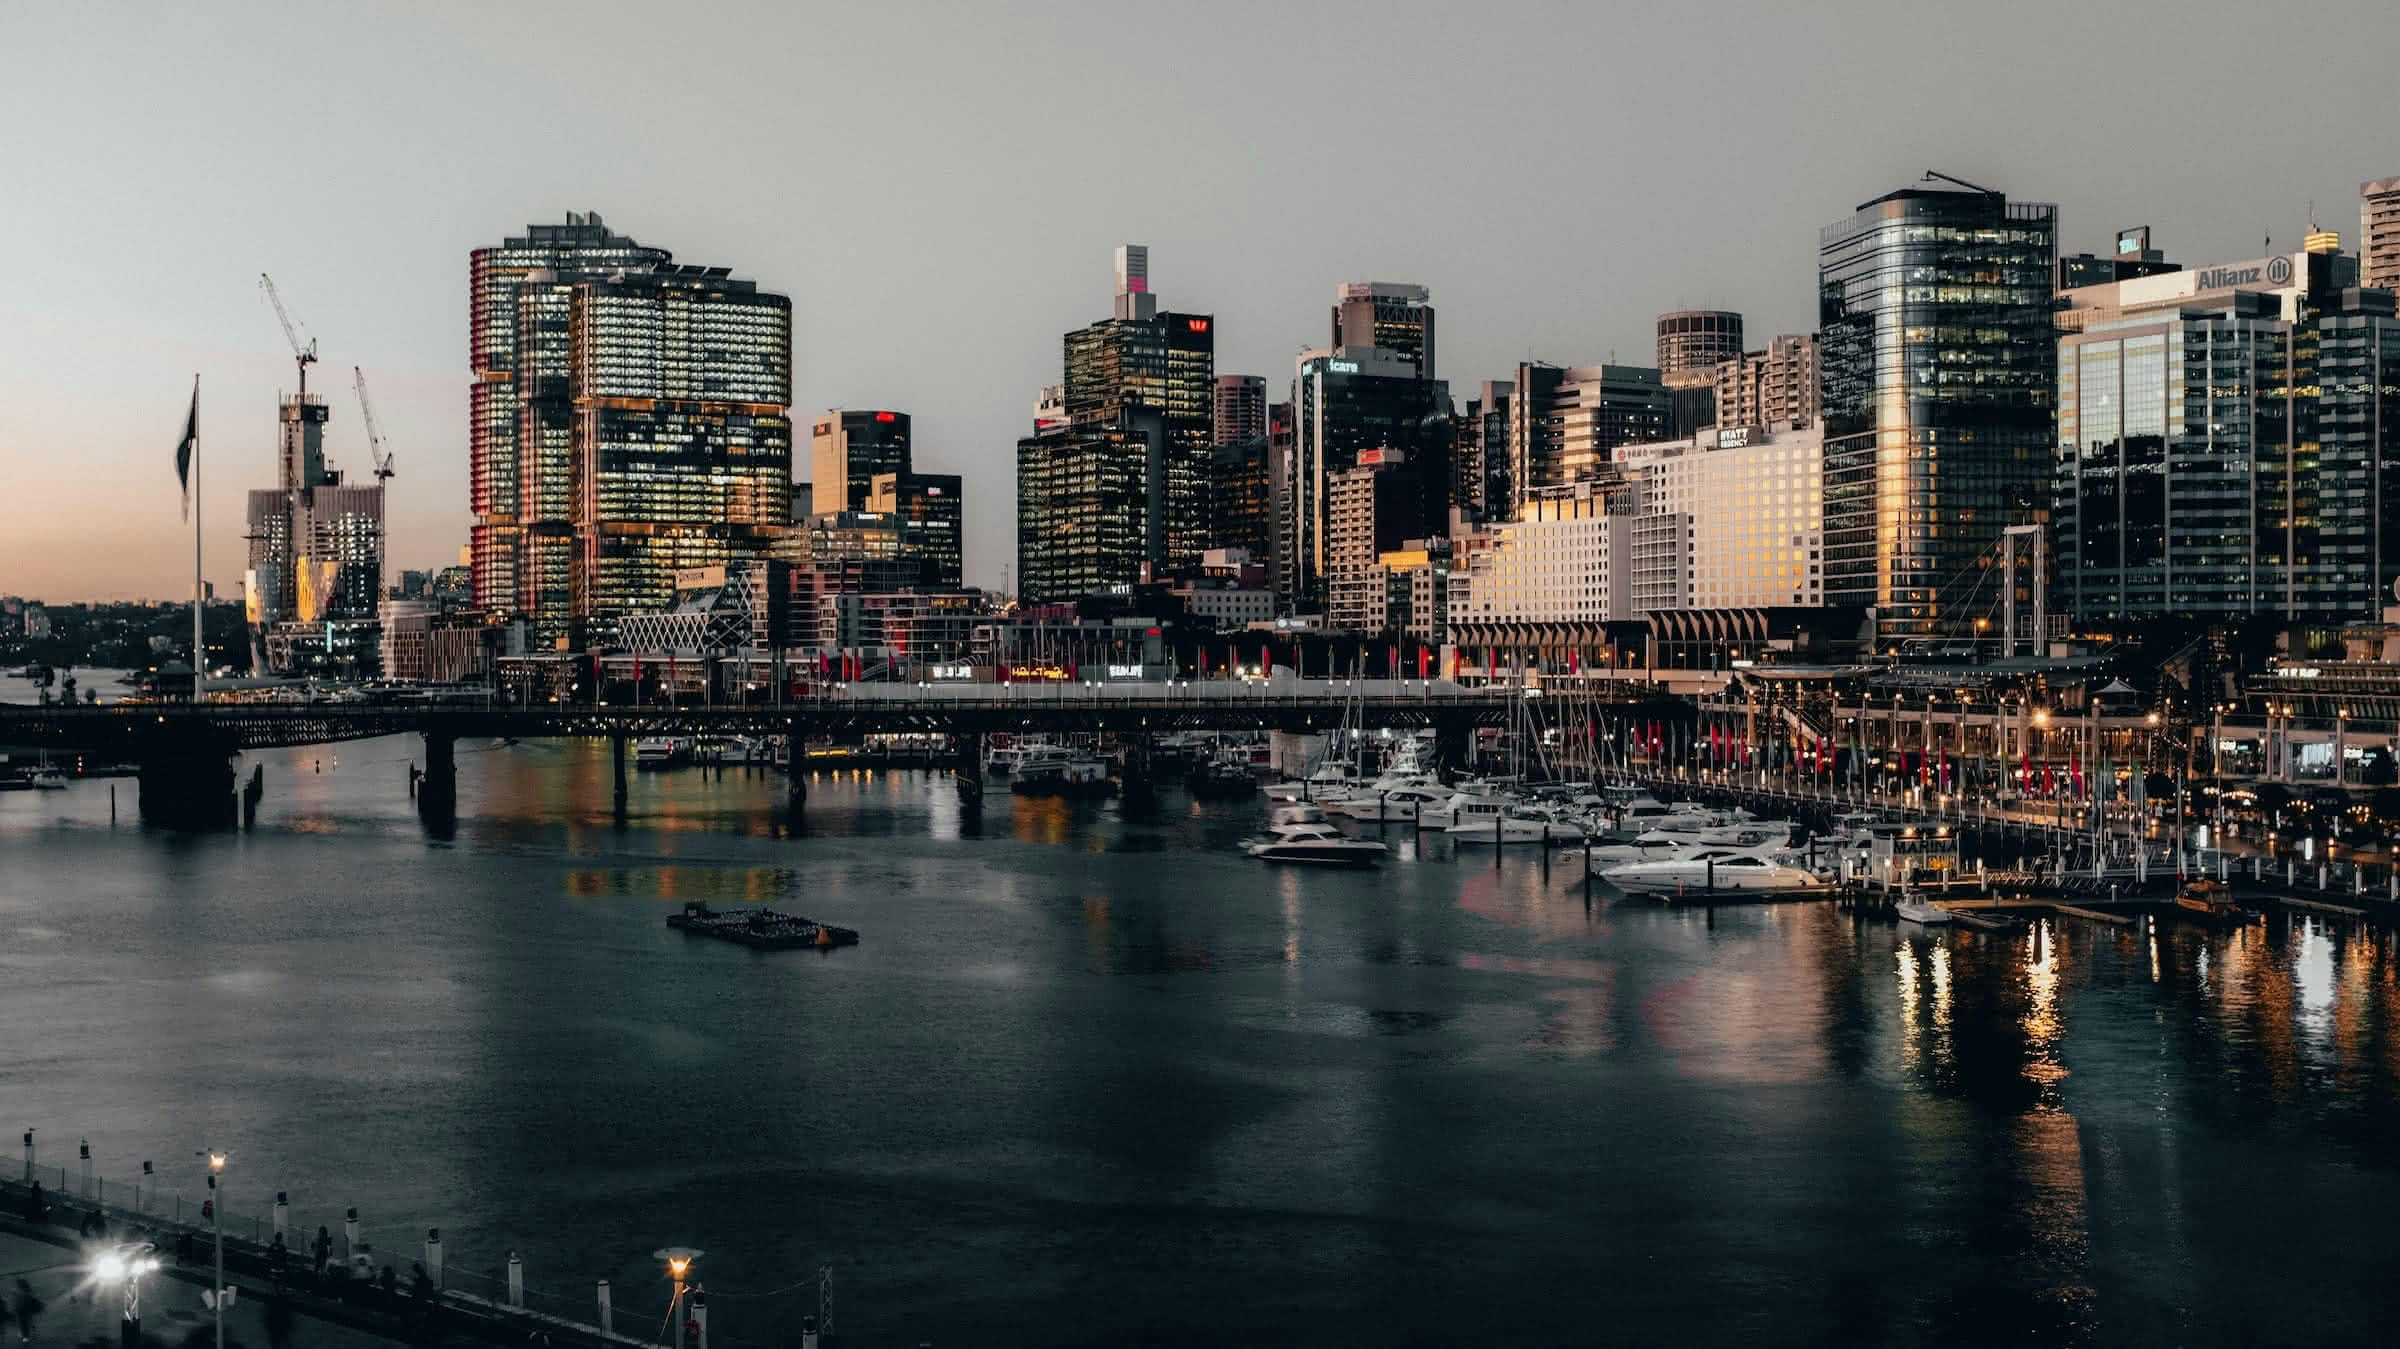
Sydney City Profile
Australia's largest city, home to the famous Sydney Opera House, the Harbour Bridge and a population of 5 million people. The bustling city is a constant attraction for tourists from Australia and abroad, visiting for its stunning beaches, particularly Bondi Beach or the adventures in the Blue Mountains.
Our Capital Markets reports aim to provide a transparent view of the short-term rental market in Sydney on a month-to-month basis. We take in large sets of data and translate it into actionable insights for hosts, free of charge.
This report offers insight into the market conditions for November 2025, based on how the local Sydney market performed in October 2025.
October 2025 Summary
Nightly Rates remained flat in October 2025 by 0% to $270.85, and hosts saw unchanged occupancy rates at 56.67% across 17,074 listings.
Hosts averaged $1,074.00 per week, yielding 1.39x the annualised average of $770.00 for long-term rentals in Sydney.
Listings & Hosts
| Metric | October 2025 | September 2025 | Difference | Change |
|---|---|---|---|---|
Entire Homes | 13,568 | 13,568 | - | - |
Hosts | 7,691 | 7,691 | - | - |
Hotel Rooms | 85 | 85 | - | - |
Listings | 17,074 | 17,074 | - | - |
Private Rooms | 3,401 | 3,401 | - | - |
Shared Rooms | 20 | 20 | - | - |